In the previous post, we’ve created a simple pipeline that builds and tests our application. We know that our tests ran successfully, but that’s all. We don’t actually know how much code we are testing.
What’s code coverage 🔗
I really like the definition that was given in this stackoverflow post. As mentioned:
Code coverage is a measurement of how many lines/blocks/arcs of your code are executed while the automated tests are running.
Code coverage is collected by using a specialized tool to instrument the binaries to add tracing calls and run a full set of automated tests against the instrumented product. A good tool will give you not only the percentage of the code that is executed, but also will allow you to drill into the data and see exactly which lines of code were executed during a particular test.
If you are using Visual Studio on Windows, chances are that you’ve already come across this.
But what if you are using something else like Linux, Mac, Visual Studio Code, Sublime, etc. ?
There are many alternatives, but I’ve followed that is on the Microsoft Learn - Run quality tests in your build pipeline by using Azure Pipelines.
I want the application to be cross platform and to compile on any supported platform, so we will be using coverlet. Coverlet generates the reports as XML files, allowing users to select different output code coverage formats such as Cobertura and JaCoCo, which are the ones supported by Azure Pipelines.
The final step is to generate a report that’s easily readable by humans, hence we convert it to HTML. For that, we use the ReportGenerator.
Prepare the repository 🔗
Let’s configure our environment to support code coverage generation.
This means:
Create a tool-manifest - This will indicate which tools we need for our project
Install the ReportGenerator
Add a the
coverlet.msbuildnuget package to the test project
Go to the root of the repository and run (through your terminal)
dotnet new tool-manifest
A new folder named “.config” will be created, as well as a “dotnet-tools.json” file.
Then install the ReportGenerator by running the following:
dotnet tool install dotnet-reportgenerator-globaltool
This will add an entry to the previously created json file.
Finally, add the coverlet.msbuild package to the test project, in this case:
cd GreeterProject/GreeterTests/
dotnet add package coverlet.msbuild
We are now ready to test if we can get code coverage by running the tests locally.
To do so, all we have to do is pass some parameters to the dotnet test command
dotnet test /p:CollectCoverage=true /p:CoverletOutputFormat=cobertura /p:CoverletOutput=./TestResults/Coverage/
The parameters are pretty self-explanatory: we want to collect code coverage, using cobertura as output format, and we want our results to be inside a Coverage folder inside a TestResults folder.
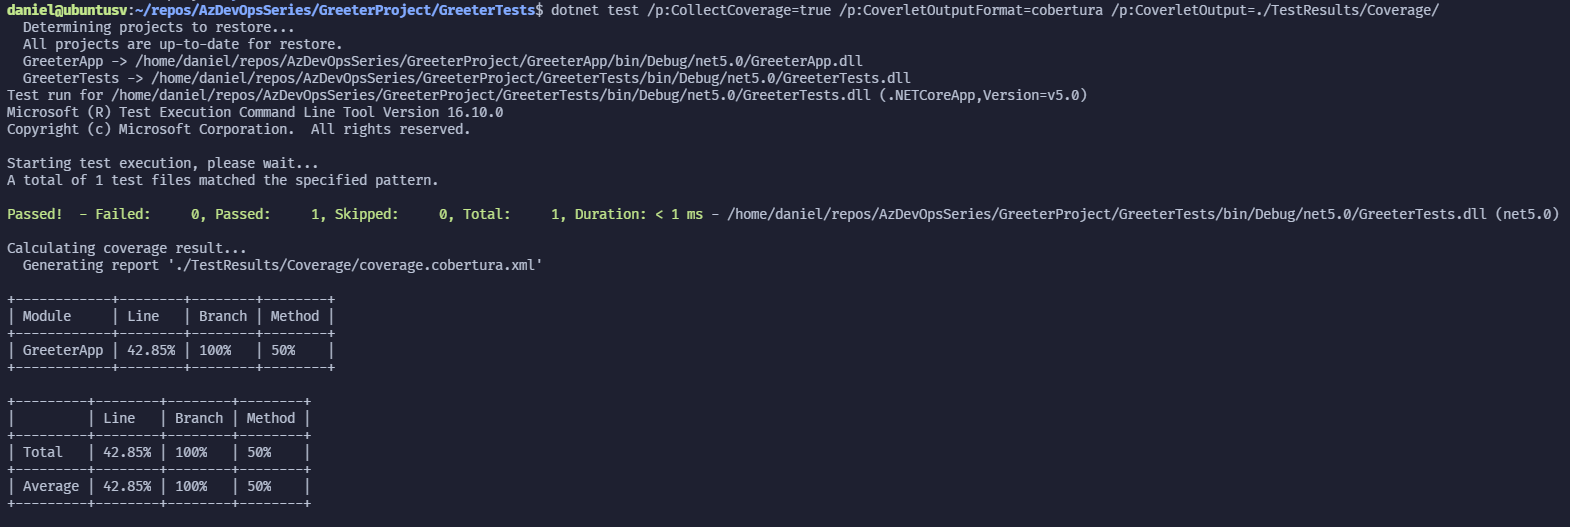
Running this, we get a table output to our terminal and a XML file generated where we specified. This seems promising. Now all we have to do is adapt this command to run on our pipeline.
Modifying the pipeline to generate code coverage and display it 🔗
We need to replicate the steps we just did on our pipeline.
So, we need to change from just testing, to install the dependencies first, change the test task to run code coverage, generate the report, and publish them into the pipeline.
The only step we didn’t do locally was the one to generate the code coverage report (lines 16-21), but I believe the command is self explanatory.
Notice that we are saying that the reporttypes is HtmlInline_AzurePipelines, this is specifically formatted so that it can be correctly displayed on our pipeline tab.
The final pipeline looks like this:
Running the new pipeline and analysing the results 🔗
Now when we run our pipeline and once it finishes, we can see a new tab called “Code Coverage”
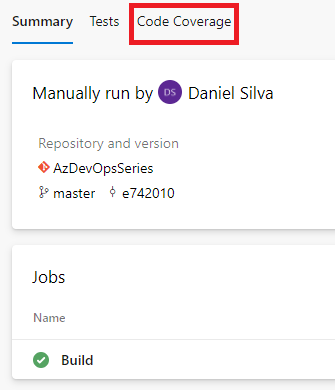
This tab shows amazing insights about the code coverage on your project. It has a small report with code coverage results such as covered and uncovered lines, branches, etc. But, even better, it shows the code coverage on different classes, methods and even highlights which lines are covered and which are not!
Here’s a gif showing you just that (you can also check it yourself by heading to the results)
Important note! 🔗
You can organize your pipelines with different stages. This allows you to have different configurations/rules according to your needs. I will cover stages on another post, but one important thing to keep in mind is that the code coverage tab will only show when the pipeline finishes. This means that if you have a build and a deploy stage, this tab will only show after the deploy runs (or is cancelled).
From my understanding, a pipeline is considered to be “finished” if there are no pending jobs, regardless if the jobs failed or succeeded.